The Overall Dashboard
The Overall Dashboard is the landing screen after sign-in. It gives a cross-project, tenant-wide view of security posture over the last 30 days (for time-windowed sections).
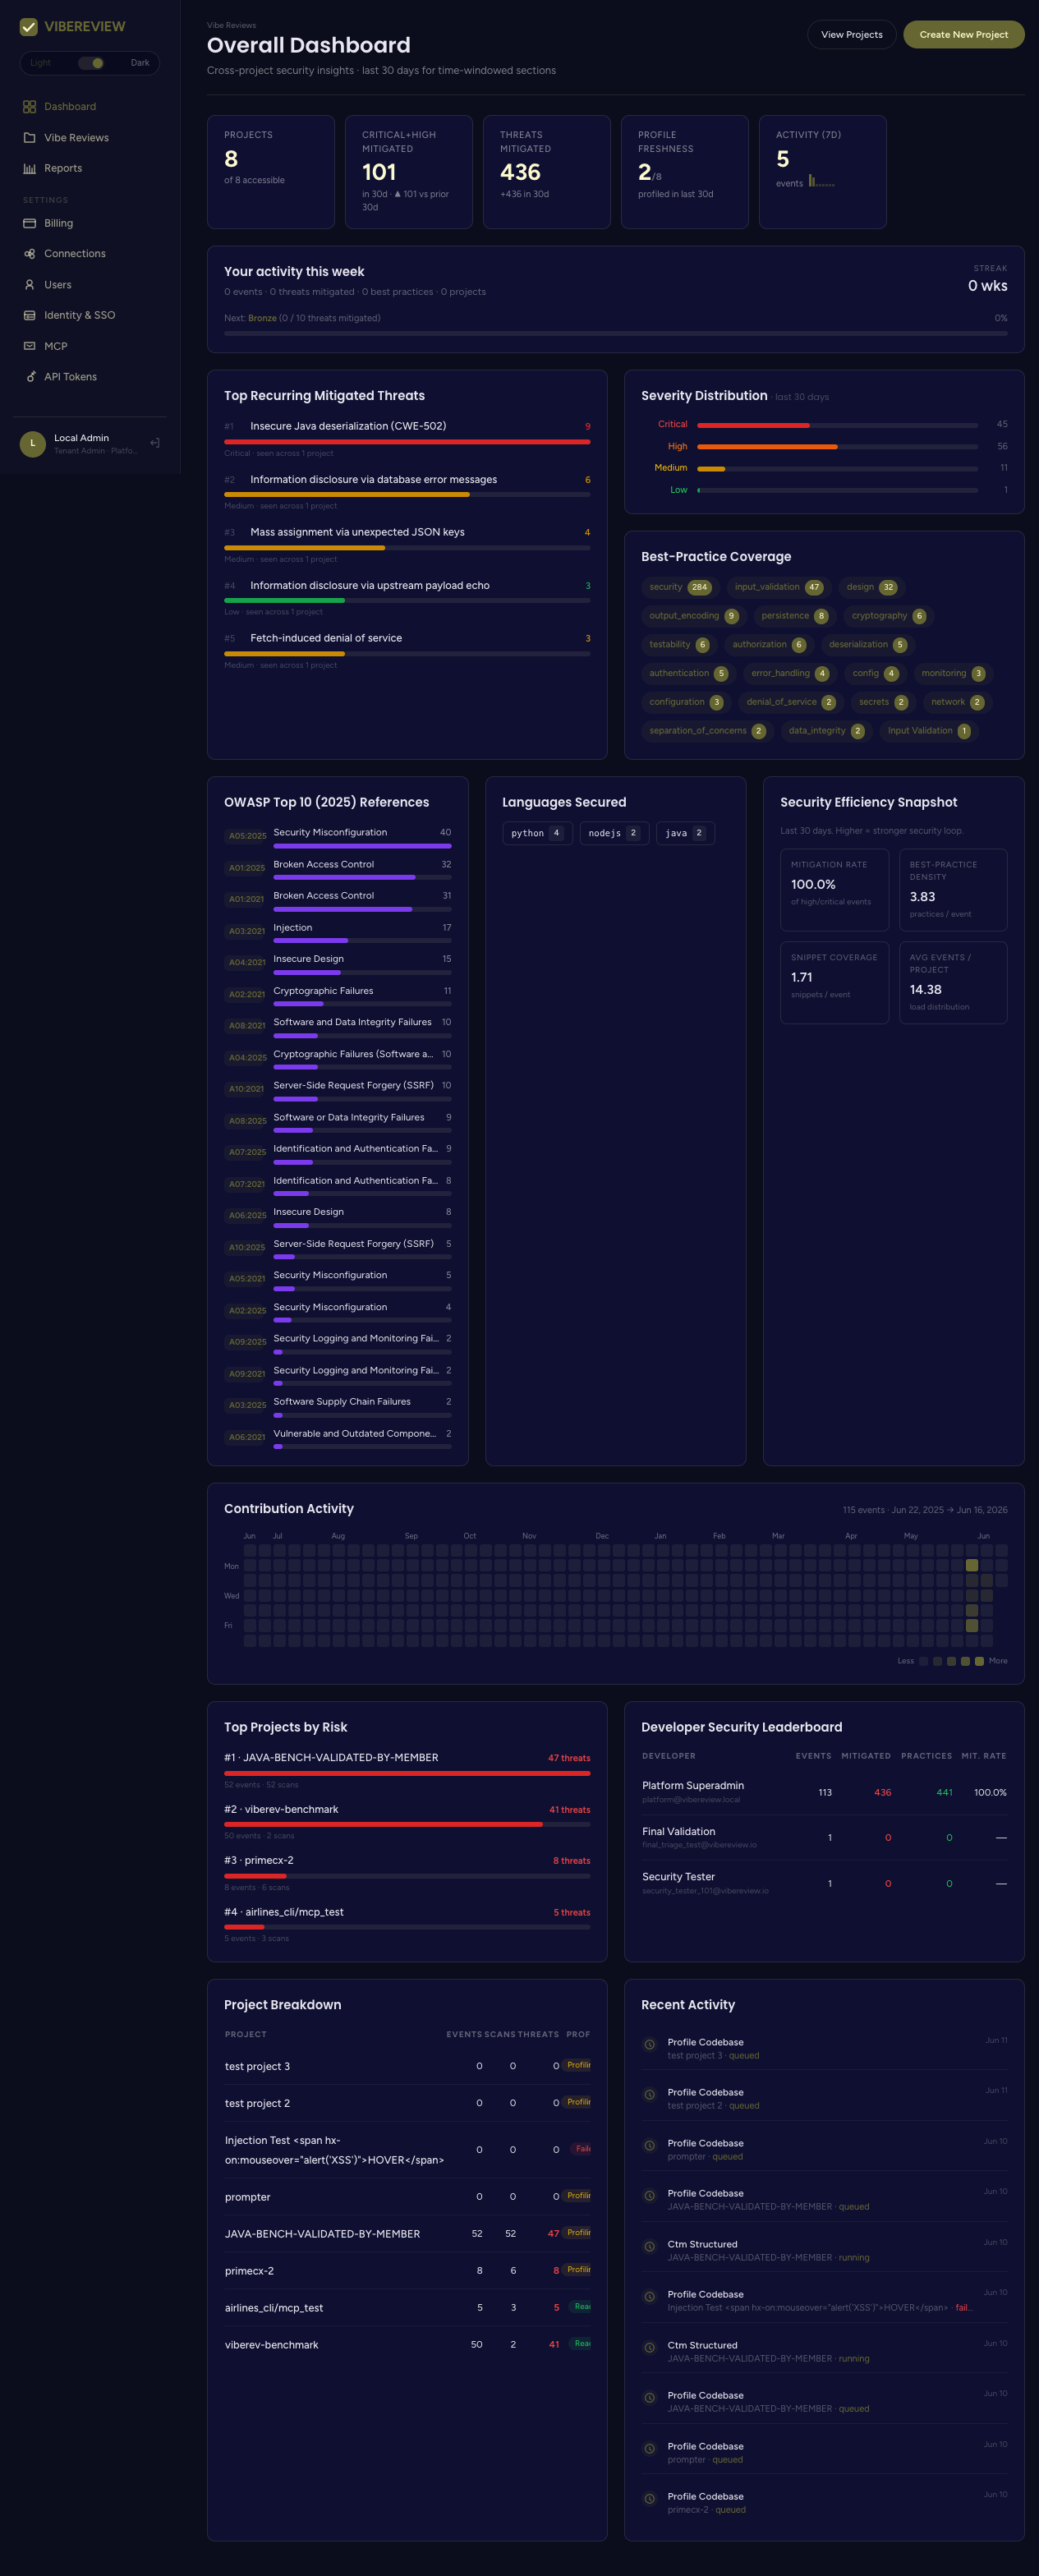
Top metrics
Four headline tiles summarize the tenant:
| Tile | Meaning |
|---|---|
| Projects | Total projects and how many are accessible to you (e.g. 8 of 8 accessible). |
| Critical+High Mitigated | Count of critical/high threats mitigated in the last 30 days, with trend vs. the prior period. |
| Threats Mitigated | Total threats mitigated in the window. |
| Profile Freshness | How many projects were profiled in the last 30 days (e.g. 2/8). |
| Activity (7d) | Events in the last seven days. |
Quick links View Projects and Create New Project sit alongside the tiles.
Your activity & streak
A personal panel shows your events, threats mitigated, best practices, and projects this week, plus a streak and progress toward the next tier (Bronze → …). This drives the gamified developer leaderboard.
Security analytics
The dashboard then breaks posture down across several panels:
- Top Recurring Mitigated Threats — the most frequently mitigated threats (e.g. Insecure Java deserialization (CWE-502)), with severity and project spread.
- Severity Distribution (30d) — Critical / High / Medium / Low counts.
- Best-Practice Coverage — best practices applied, grouped by category (security, input_validation, design, output_encoding, cryptography, …).
- OWASP Top 10 References — activity mapped to OWASP 2021 and 2025
categories (e.g.
A05:2025 Security Misconfiguration). - Languages Secured — events per language (python, nodejs, java, …).
Security Efficiency Snapshot
A set of ratios that describe the strength of the security loop over the last 30 days:
| Metric | Meaning |
|---|---|
| Mitigation Rate | Share of high/critical events mitigated (e.g. 100.0%). |
| Best-Practice Density | Best practices applied per event. |
| Snippet Coverage | Secure code snippets per event. |
| Avg Events / Project | Load distribution across projects. |
Activity & top projects
- Contribution Activity — a GitHub-style heatmap of events over the year.
- Top Projects by Risk — projects ranked by threats, with event and scan counts; each links to the project.
- Developer Security Leaderboard — a table of developers by events, threats mitigated, and more.
Where to go next
- Drill into a project from Top Projects by Risk, or open the full list under Vibe Reviews / Projects.
- Export tenant-wide views from Reports.